Author: Alex Van Breedam
last updated: 19 February 2024
![]()
Video presentation
![]()
Podcast
![]()
Full Article
![]()
Section play
The “Lessons From 2023” is a concise report based on information published on the ISCN.Academy website with, on the one hand, the unique supply chain timeline with news, analyses and events and, on the other hand, the in-depth interviews held with supply chain professionals.
This report navigates key events of 2023, analyzes the global landscape, and explores future trends. With a special focus on the ever-evolving transport and logistics sectors, it offers valuable insights and recommendations to help companies navigate the future. The “Lessons from 2023” comes in various formats, including an easy-to-read article, an engaging podcast and an interactive video presentation.
OVERVIEW > Contents
GLOBAL ECONOMY > State of economy
SUPPLY CHAINS > State of supply chains
OCEAN FREIGHT > Overseas transport market
TRANSPORTATION AND STORAGE > Logistics industry
RECOMMENDATIONS > What should companies do?
Global Economy
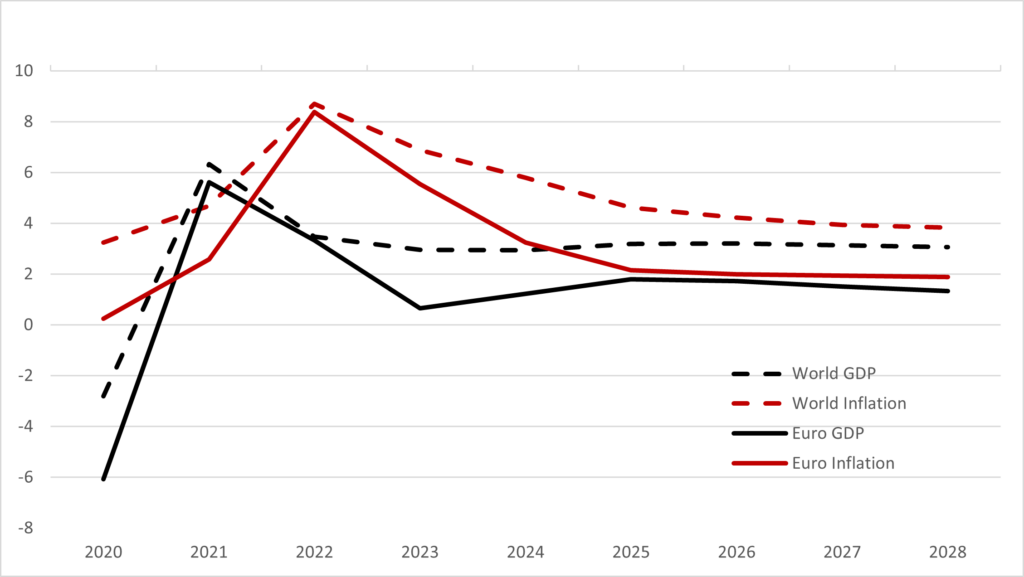
2023 was a year of slow and fragile global economic growth. Inflation and geopolitical tensions were significant challenges. The IMF further emphasized the risk of long-term damage to supply chains, particularly in Europe, heavily reliant on Russian energy and commodities. Beyond Ukraine, other conflicts like the war in Israel and Hamas exacerbated global trade tensions and geopolitical uncertainty. These factors combined present a significant threat to economic stability, demanding urgent and coordinated international action to prevent escalation and minimize humanitarian and economic costs. Against this background, the global economy faced a slowdown, witnessing a shift from 3.4% growth in 2022 to hardly 2.8%. At the end of 2023, the GDP growth improved slightly to 2.9%. Even emerging markets experienced a subtle dip in growth, moving from 4.1% in 2022 to 4.0% in 2023.
Figure 1
2023 presented a shifting landscape for Europe’s GDP. Despite a robust expansion in 2022, growth was subdued, registering at a modest 0.6%, accompanied by a challenging 5.6% inflation rate and a 6% unemployment rate.
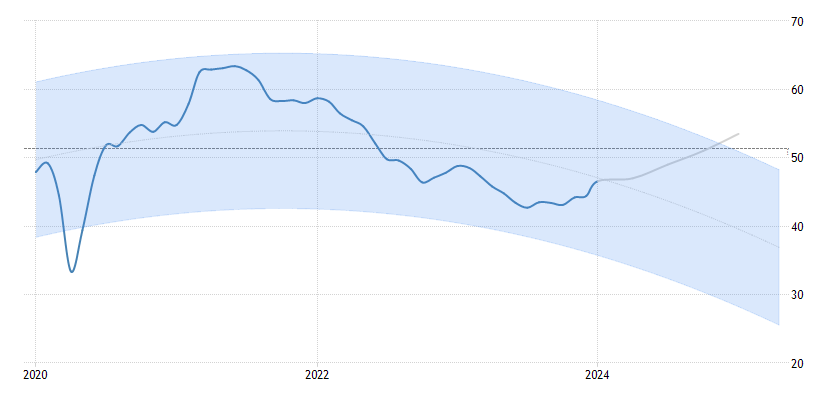
PMI suggest limited recovery for 2024
2024 does not look very promising either, based on the evolution of the Manufacturing Purchasing Managers’ Index (PMI) in the Eurozone. The value of the PMI was below 50 points throughout 2023 and is currently projected to remain below 50 points in 2024, which indicates a contraction. However, from the second half of 2023, the PMI value is increasing. Traders closely watch the PMI as it offers early insights into company performance and can be a leading indicator of overall economic health.
Supply Chains
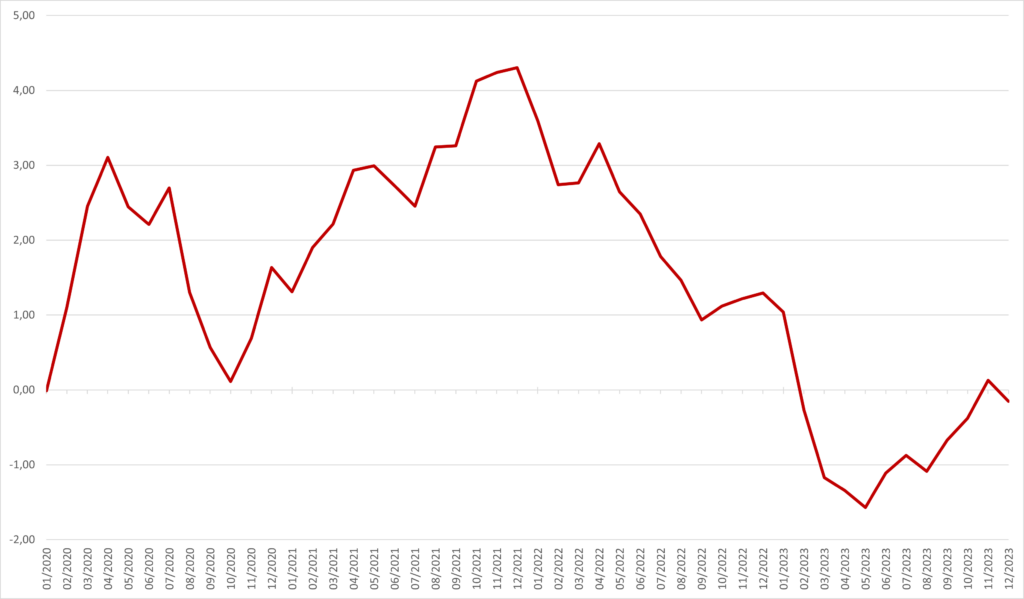
The year 2023 was characterized by a downturn in demand, despite warehouses remaining well-stocked, leading to a noticeable deceleration in operational pace as reflected in the Global Supply Chain Pressure Index. Many companies spent the year recovering from the bullwhip effects, strategically reducing their accumulated inventories to ensure timely deliveries amidst the anticipated surge in demand following the COVID-19 pandemic.
5% less supply chain disruptions in 2023, compared to the previous year
2023 saw a 5% decrease in supply chain disruptions compared to the previous year, according to Resilinc. However, factory fires (topping at a staggering 2,889!), business changes like mergers and acquisitions, labor strikes, natural disasters, and even ESG non-compliance incidents continued to cause significant hiccups. The wars in Ukraine and Gaza further complicated the global picture, while attacks by Houthi rebels in the Red Sea threw shipping routes into disarray and pushed up supply chain costs, hindering efforts to curb inflation.
Figure 3
Amidst the chaos, agile companies carved out a path to success. These champions recognized the need for resilience, building strong capabilities and achieving end-to-end visibility across their supply chains. Equipped with this agility, they navigated the waves of disruption, even turning it into a competitive advantage.
Risk management and resilience became top priorities
This agility wasn’t achieved through magic, but through digital transformation. Companies embraced big data, advanced analytics, and automation like never before, optimizing their operations for speed and efficiency. Risk management and resilience became top priorities as businesses learned to stay on their toes, ready to tackle both threats and opportunities.
One of the most significant transformations came in the form of AI. No longer simply repeating historical patterns, forecasting tools now leverage powerful AI algorithms to predict future events. This allows companies to anticipate market shifts and proactively adjust their production, inventory, and logistics, gaining a crucial edge in a volatile market. The integration of AI marks a pivotal point in supply chain management, and its impact will continue to ripple outwards in the years to come.
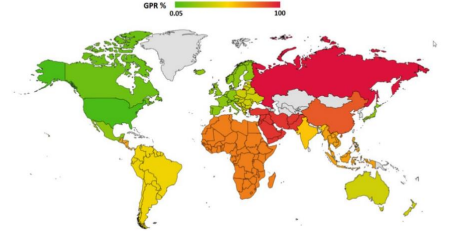
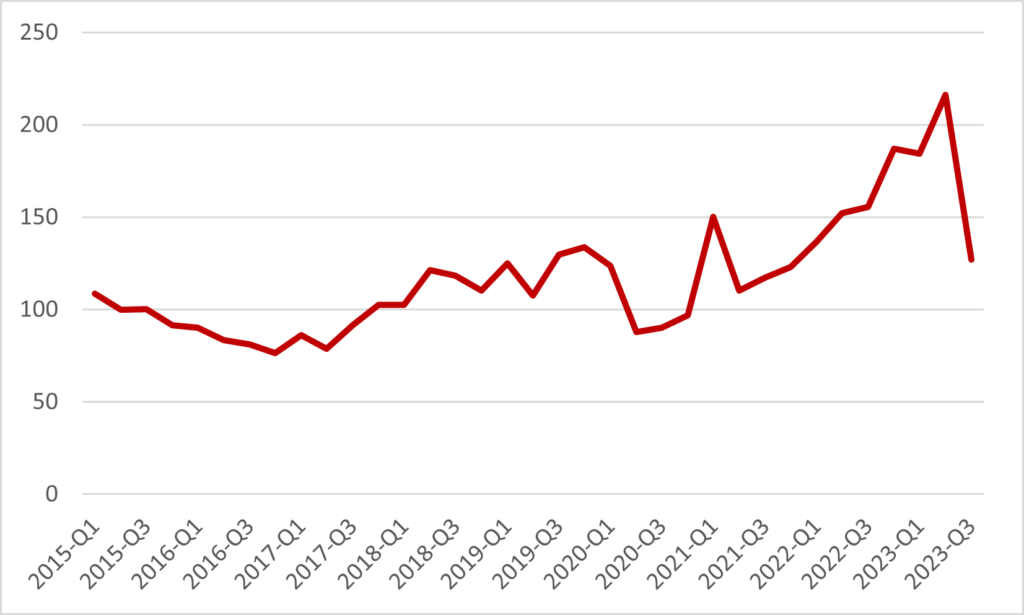
The COVID-19 pandemic prompted companies to rethink their risk mitigation strategies, leading to broader supplier diversification. This included reshoring (bringing production back home), nearshoring (moving it to nearby countries), and friendshoring (shifting to allies with similar values). As Figure 4 illustrates, geopolitical tensions further fueled these trends.
Figure 4
Governments in Europe and the US actively supported reshoring, especially in critical sectors like semiconductors, electronics, technology, and clean energy. Initiatives like tax breaks and subsidies helped narrow the cost gap between Asian production and nearshoring, as highlighted by Capgemini Research Institute‘s estimate that 25% of global trade could relocate in the next three years. However, as SAP points out, not all production can be easily nearshored. Complexities and long implementation times require careful planning and strategic decision-making.
India is closing the gap with China
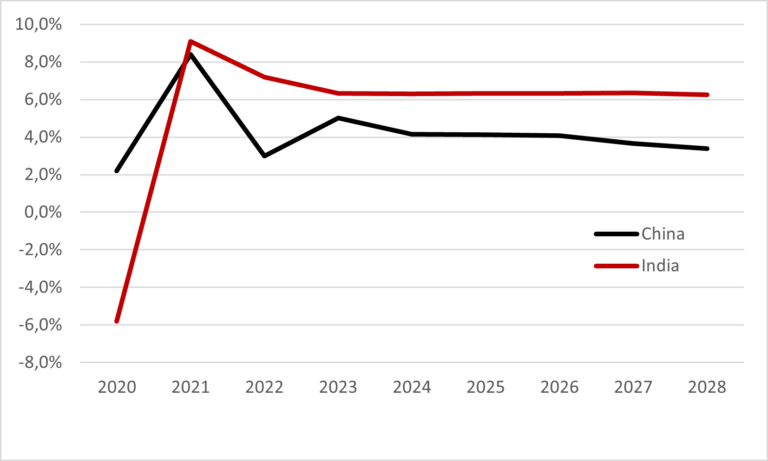
China continues to hold the top spot in the Emerging Markets Index, but faces a closer competitor in India. India’s robust economic growth has narrowed the gap significantly compared to previous years, as illustrated by Figure 5, which shows projections for both countries’ future GDP growth. This trend signals potential shifts in the global economic landscape, with India emerging as a strong contender in the emerging markets.
Figure 5
CSRD will require companies to report on scope 3 emissions from 2026 onwards.
Building green, responsible, and future-proof supply chains has become a top priority, with growing attention paid to several key areas like circularity, ESG, use of green energy and sustainable packaging. These trends are further fueled by the upcoming Corporate Sustainability Reporting Directive (CSRD). As from 2026, companies will be required to report not just their direct emissions (Scope 1 and 2) but also their indirect emissions across their entire value chain (Scope 3). This broader scope, encompassing suppliers, distributors, and even product use and end-of-life stages, will significantly increase the focus on Scope 3 emissions within supply chains.
The global economic slowdown in 2023, characterized by declining demand and inflationary pressures, certainly pushed many companies to prioritize cost-cutting strategies. This trend significantly impacted transportation activities within supply chains, as companies sought to optimize logistics and reduce expenses.
Ocean Freight
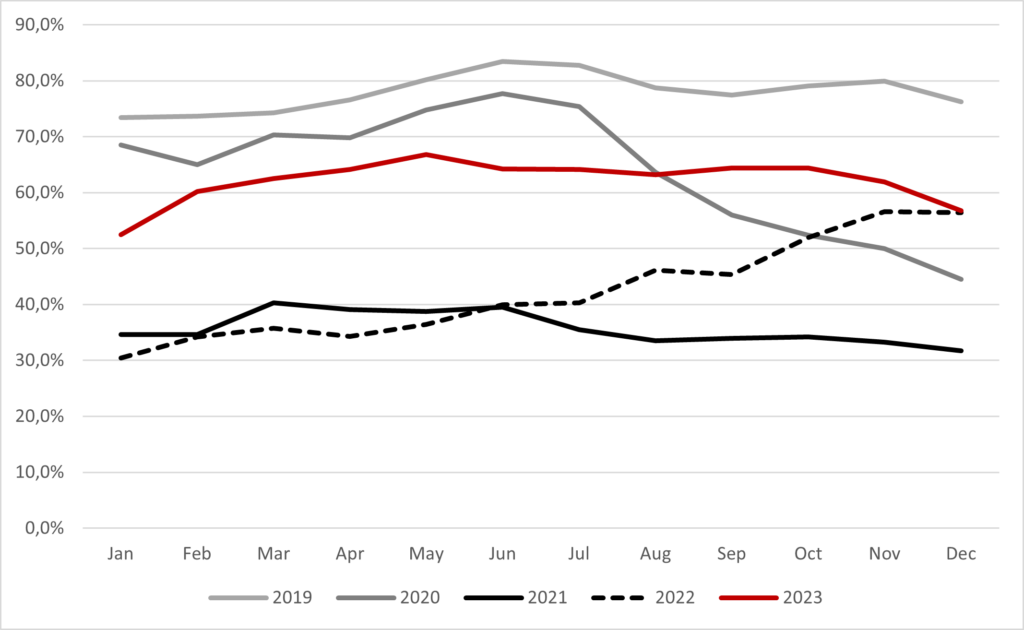
After the tumultuous post-pandemic years, the ocean freight market chilled further in 2023. Though schedule reliability rose, but never exceeding 65%, it remained far from smooth sailing.
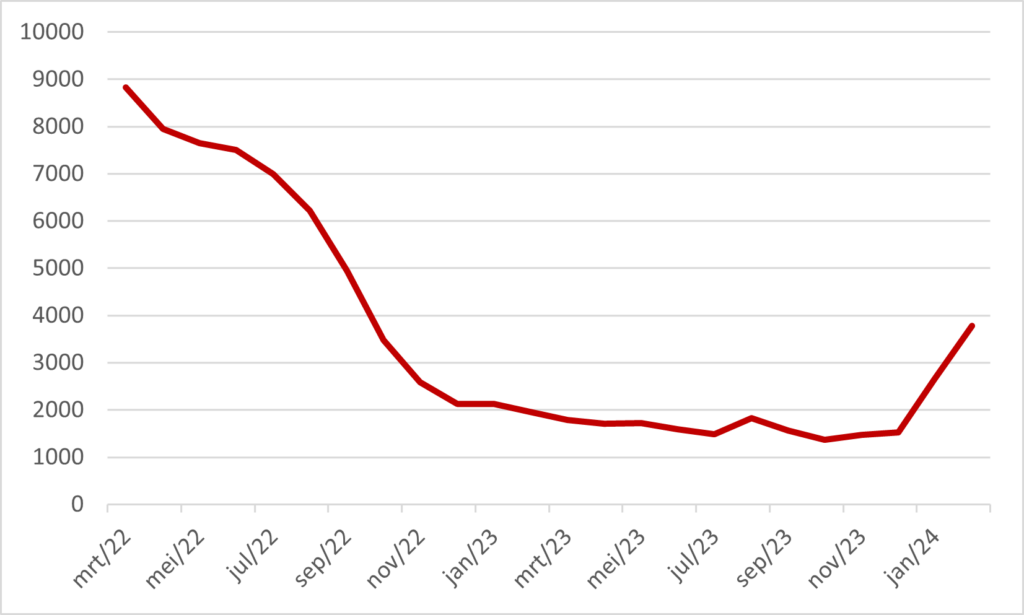
From their September 2021 peak, overseas container rates steadily dipped as supply chain disruptions eased, returning to pre-pandemic levels by mid-2023 as can be seen from Figure 7.
Short-term events could temporarily halt the ongoing structural decline in freight demand
However, by the end of November 2023, tariffs began to rise once again in response to Houthi attacks in the Red Sea, stemming from the Israel-Hamas conflict. Reuters estimates indicate that approximately 65% of vessels opted to avoid the Suez Canal. Given that over 12% of global trade relies on the Suez Canal, this avoidance, following the Ever Given crisis, constitutes a significant disruption to global supply chains. Mainly focusing on container vessels, these attacks compelled the majority of ships to divert their routes through the lengthier South African passage, leading to a surge in demand for vessel capacity. Furthermore, the need for additional capacity arose as ships were rerouted due to the diminished capacity of the Panama Canal, attributed to drought conditions starting from the final quarter of 2023.
Amidst disruptions affecting ocean freight, the China-Europe rail connections have emerged as a valuable alternative. Their available capacity and stable lead times, typically ranging from 15 to 25 days, depending on the specific route, offer businesses greater predictability and agility. Additionally, they can contribute to lower carbon emissions.
Issues arising from an oversupply in a market that is contracting
Nevertheless, the near-term outlook for ocean freight rates appears bleak, as the balance between supply and demand continues to worsen, placing shipping companies at a disadvantage. The influx of new vessel deliveries and subsequent expansion of overcapacity coincides with declining demand, compounded by companies’ initiatives aimed at diversification and reshoring to mitigate risks and streamline supply chains. While so far Sea-Intelligence observed no reduction in average distance per TEU in 2023, suggesting limited nearshoring activity, such initiatives typically take years to implement (SAP 2022).
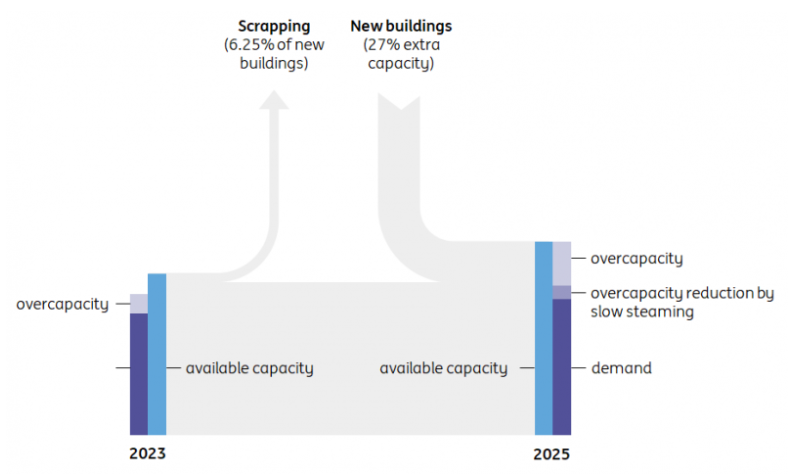
Figure 8 projects a concerning 27% increase in installed fleet capacity between 2023 and 2025, with 18% still to be delivered. This could lead to a sustained decline in rates that might persist until 2028. Slow steaming, scrapping, and canceled sailings can only partially offset this overcapacity.
Figure 8
The profitability of ocean carriers is at stake for the years ahead
In the coming years, container shipping companies are likely to face additional financial strain. The anticipated decline in profitability could prompt shifts in alliances and collaborations. Adding to this complexity is the impending end of the block exemption from EU competition regulations, effective from April 2024. This change may impact cooperation dynamics within existing alliances.
Notably, the 2M Alliance, comprising Maersk and MSC, will cease to exist by the end of 2024. However, Maersk is already charting a new course. In February 2025, it will join forces with Hapag-Lloyd in the Gemini Alliance, a strategic, long-term operational collaboration.
Transportation and Storage
Road transport volume dropped with 4% in 2023 and will partially recovery in 2024
2022’s post-pandemic demand surge strained road freight capacity, but 2023, with its economic challenges (e.g., inflation, fuel costs), saw a shift. The decrease in transport volume in Europe started in the second half of 2022, is significant and amounts around 3%. The modest recovery in 2024 is predicted at about 1%.
Figure 9
The unfortunate slowdown in demand arrives just as many transport companies grapple with the increased burden of inflation, rising wages, tolls, and energy costs. This creates a challenging scenario, especially for smaller firms unable to fully pass on these cost increases to their clients. Eurostat data reveals a 27.2% rise in bankruptcies for 2022, with the second quarter of 2023 already showing a 15.2% increase compared to the previous quarter and a staggering 82.5% increase compared to pre-pandemic levels in Q4 2019. Figure 10 data paints a concerning picture for the industry, highlighting the potential for further bankruptcies unless the demand-cost imbalance improves.
Figure 10
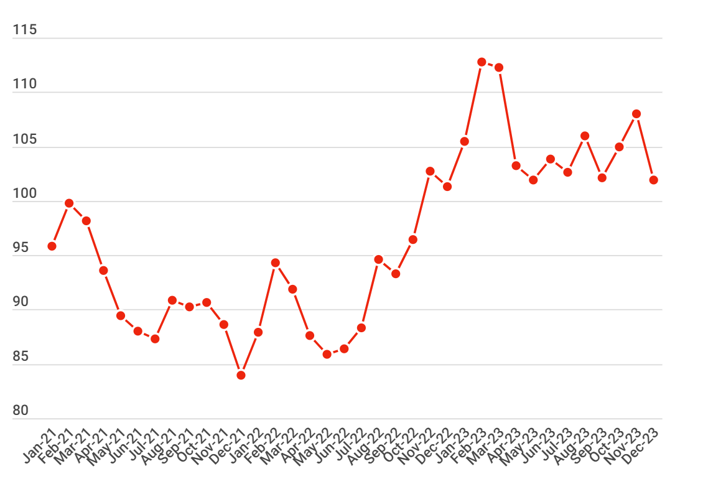
The Transporeon Capacity Index reflects this, remaining largely above 100 since November 2022, indicating ample capacity. While end-of-year sales temporarily reduced excess capacity, throughout 2023, the overall market had offered ample truck availability.
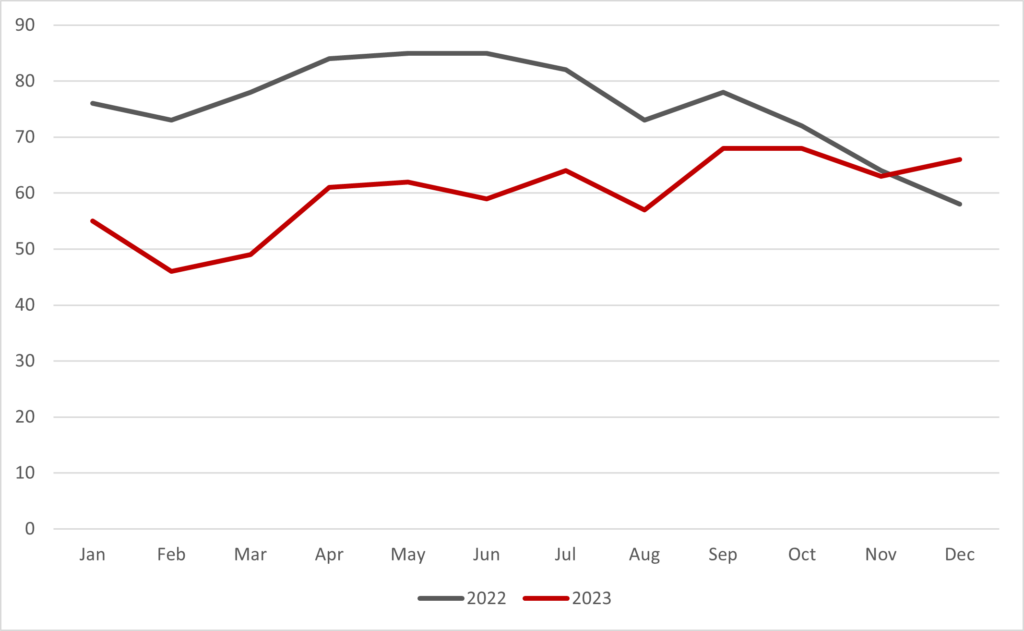
As illustrated in Figure 12, Timocom‘s transport barometer reflects this ample capacity, with a ratio indicating the availability of trucks even during the seasonal upswing towards the end of the year.
Figure 12
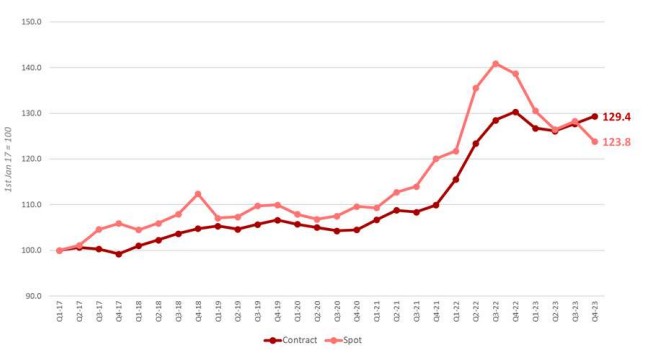
As 2023 progressed, the road transportation market saw a shift towards shippers, with demand decreasing. This led to road transport providers competing fiercely for business, driving down spot rates. Notably, for the first time since 2017, Q4 2023 saw spot rates dipping below contract rates, marking a significant shift in market dynamics, as illustrated in Figure 13.
Figure 13
Shorter contract durations and more frequent tender process are expected in a contracting transport market
With a shipper’s market gaining ground, cost pressures on carriers will intensify. This shift will likely see a resurgence of frequent tender processes, which had significantly decreased during the post pandemic capacity shortage period when securing capacity was the top priority. With transportation demand slowing down throughout 2023, corporations may opt for shorter contract durations to capitalize on more frequent benchmarking and tendering opportunities.
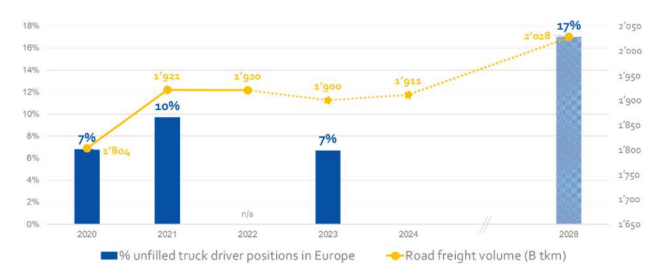
However, the ongoing driver shortage in road transport casts a shadow over these cost-saving efforts. As Figure 14 illustrates, this shortage will even amplify in the next years, posing a significant and growing challenge for the transport and logistics industry.
Figure 14
Technology and infrastructure for zero emission long haul transport is still immature
Achieving sustainability remains a top challenge for the transportation industry, with stricter regulations like Euro VII for trucks and the EU’s Emission Trading System in 2027 driving pressure towards cleaner operations. Carbon pricing mechanisms like the German Maut will further incentivize the adoption of more sustainable transport equipment. However, the economic slowdown of 2023 and 2024, coupled with immature technology and limited charging infrastructure, make widespread adoption of zero-emission vehicles challenging. As a result, many carriers in 2023 focused on “insetting” initiatives, such as using Hydrotreated Vegetable Oils (HVO) and biofuels as alternative fuels. While offering some emission reduction, these solutions have limitations compared to zero-emission technologies. Looking ahead, 2024 will see a significant increase in available battery electric heavy-duty vehicle models, offering hope for future progress in decarbonizing the industry.
The logistics real estate also experienced a decline as compared to the boom of 2022. Economic tremors, including inflation and rising interest rates, rattled business confidence, leading to a 26% drop in leased space (BCI Global, 2024). Shifting supply chains, with companies diversifying production closer to home, further reduced warehouse demand. Concerns of oversupply loomed, as a significant amount of new space had recently been constructed.
4.3% vacancy rate for logistics real estate
This translated into rising vacancy rates across Europe, reaching 4.3% at the end of 2023, signaling more available space (JLL, 2023). Prime yields, the return investors expect on prime properties, edged up slightly, making investments less attractive. While regional pockets like Poland and the UK witnessed relative stability, markets like Spain, Netherlands, and Romania faced steeper declines in demand and rising vacancies.
Looking ahead, experts predict a market stabilization in 2024, with lease-up expected to plateau. The industry might also face long-term structural changes due to reshoring and supply chain diversification, impacting demand for different types and locations of warehouse space.
Recommendations
The valuable supply chain lessons extracted from 2023 closely echo those from the preceding year, 2022. Furthermore, the outlook for 2024 seems to mirror previous trends, barring any unforeseen crises or disruptions.
A company should become digital, physical and process agile
Managing a supply chain in a volatile, uncertain and complex environment requires digital, physical and process agility and resilience to better anticipate on shocks and disruptions. Companies should acquire digital agility by gaining visibility of their end-to-end supply chain down to the second and third tier suppliers. Moreover, digitalization efforts should be sustained to organize the faster flow of information throughout the supply chain and to avoid costly bullwhip effects. Additionally, companies should continue to invest in cybersecurity.
Strategically managing stockkeeping units (SKUs) lies at the heart of physical agility, enabling companies to adapt to shifting supply and demand. Rationalizing the number of SKUs while balancing predictability and obsolescence risks is crucial. In 2023, many companies struggled with high inventory costs, obsolescence, and control expenses due to excessive SKUs. To combat this, companies can:
- Optimize SKU portfolio based on data-driven insights, considering factors like demand volatility, profitability, and supplier availability.
- Mitigate risk strategically by diversifying supplier bases at an economically balanced level.
- Address labor challenges by exploring innovative solutions like automation, reskilling, and improved recruitment strategies to overcome labor shortages and ensure efficient physical operations.
By implementing these strategies, companies can improve physical agility, enhance responsiveness, and navigate dynamic market conditions more effectively.
Finally, a company should become more process agile by embedding its digital and physical agility in its core business processes.
Supply chain crises ultimately contribute to the importance of supply chain management
A concluding remark is that Covid and its subsequent crises came with at least one upside: supply chain management has been propelled to a key topic of the company’s strategic agenda. That’s why there is now an opportunity for many companies to develop an agile, resilient and sustainable supply chain as a key competitive differentiator.
References
BCI Global (2024), Logistics real estate markets in Europe are expected to stabilize in 2024 after very disappointing 2023
Capgemini Research Institute (2022) , How greater intelligence could supercharge supply chains.
Drewry Supply Chain Advisors (2023), Drewry World Container Index.
Europe Commission (2023), Autumn 2023 Economic Forecast: A modest recovery ahead after a challenging year
Eurostat (2024), Key figures on European transport – 2023
KPMG (2023), KPMG Global Tech Report 2023
ING Research (2023), Global container shipping outlook: pressure mounts amid flood of new capacity
ING Research (2023), Slower speed, tighter control for European road haulage
International Monetary Fund (2023), World economic outlook – October 2023.
IRU, Upply, TI (2024), The European Road Freight Market Benchmark – Q4 2023.
JLL (2023), European Logistics Market Update Q3 2022.
Reuters (2024), Red Sea attacks.
Reshoring Initiative (2024), Geopolitical Risk and Industrial Policy Drive Reshoring and FDI Announcements
SAP (2022), Evaluating Nearshoring? Here are Five Realities
Sea-Intelligence (9 November 2023), No sign of nearshoring.
TI (2024), Agility Emerging Markets Logistics Index.
Trading Economics (2024), Euro Area Manufacturing Index PMI


